
Near-infrared fluorescent reagents for high-sensitivity imaging
Sciforiem ™ FI Series
This website uses automated machine translation. Please note that translations may not be fully accurate and may differ from the original Japanese text.
- This product is a "research reagent." It cannot be used for pharmaceuticals, diagnostic drugs, food, etc. (including administration to the human body for any purpose).
With the advancement of medical technology, bioimaging and quantitative analysis techniques have evolved, increasing the need for long-term observation of cells, three-dimensional observation, in vivo imaging, and even the observation and quantification of lipid nanoparticles such as liposomes and LNPs.
artience Co., Ltd. offers the cell staining reagent Sciforiem ™ FI 7500 and lipid nanoparticle staining reagent Sciforiem ™ FI 7510, which utilize our group's strengths in colorant technology.
- Reagent for Cell Staining Sciforiem ™ FI 7500
- Reagent for lipid nanoparticle staining Sciforiem ™ FI 7510
- Technology overview
- Contact Us
Reagent for Cell Staining Sciforiem ™ FI 7500
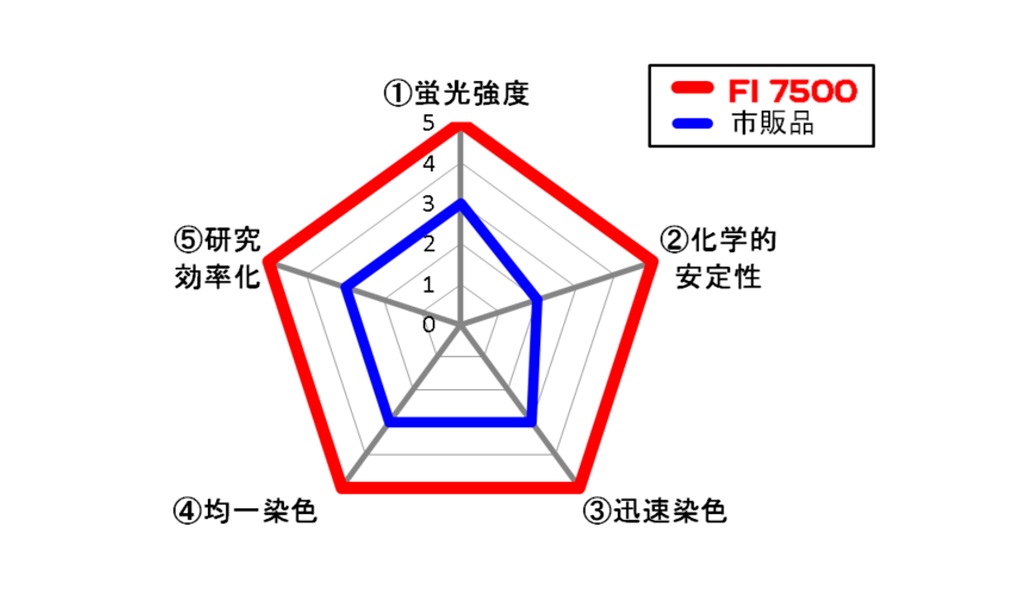
Sciforiem ™ FI 7500 solves many of the challenges faced by conventional fluorescent reagents, such as high fluorescence intensity and chemical stability that enables long-term observation.
Product features
- High fluorescence intensity
Low dyeing density enables clear imaging. - High chemical stability
It can be observed for extended periods both in vitro and in vivo. - Rapid Staining
Cell staining is possible in a shorter time compared to conventional products. - Uniform staining of cells
Imaging images with minimal dyeing unevenness are obtained. - Research Efficiency
This enables significant reductions in experimental costs and preparation periods.
Bandpass filter compatible with the spectral spectrum
Major near-infrared bandpass filters (Cy5/Cy5.5/Cy7) are available.
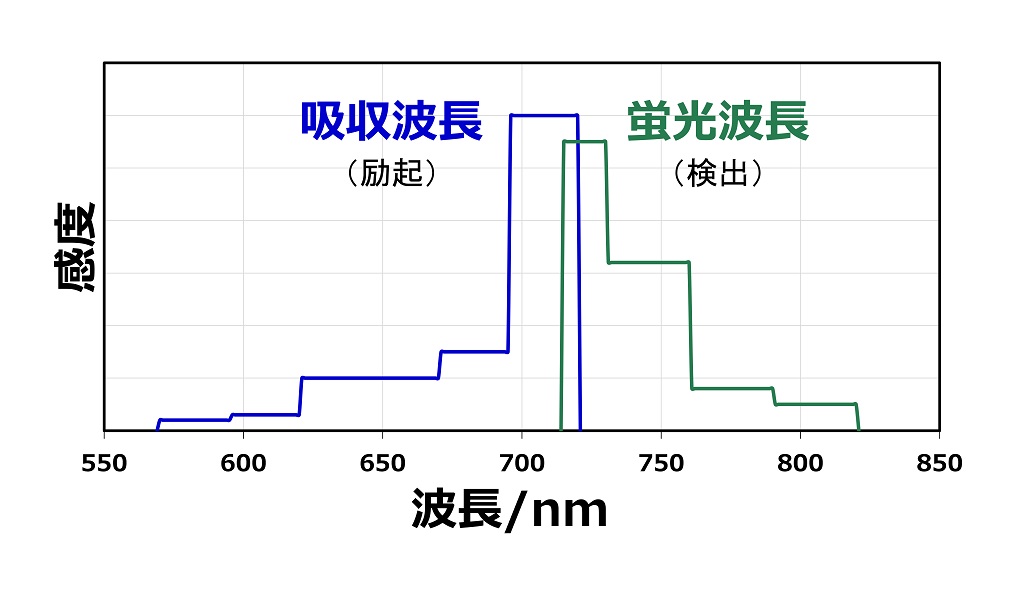
| Excitation wavelength (nm) | Detection Wavelength (nm) | |
|---|---|---|
| Cy5 | 620±30 | 700±37.5 |
| Cy5.5 | 650±22.5 | 720±30 |
| Cy7 | 710±37.5 | 810±45 |
Application example
Application Example 1: Multiple Dyeing
Multiplex dyeing is possible when combined with fluorescent reagents of different wavelengths
<Protocol>
① HeLa cells cultured in a 96-well plate are fixed and washed three times with PBS.
② Add Phalloidin-iFlour (×1000), let stand for 60 minutes (room temperature), then wash three times with PBS.
③ Add FI 7500 (0.2 μM), let stand for 30 minutes (37°C), then wash three times with PBS.
④ Add Hoechst 33342 (×1000), let stand for 15 minutes (37°C), then wash three times with PBS.
⑤ Observe with a fluorescence microscope
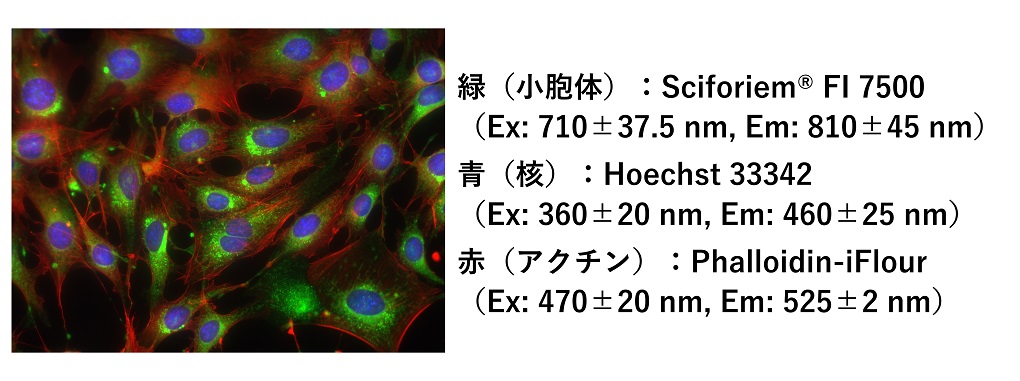
Each is shown in pseudo-colors of green, blue, and red.
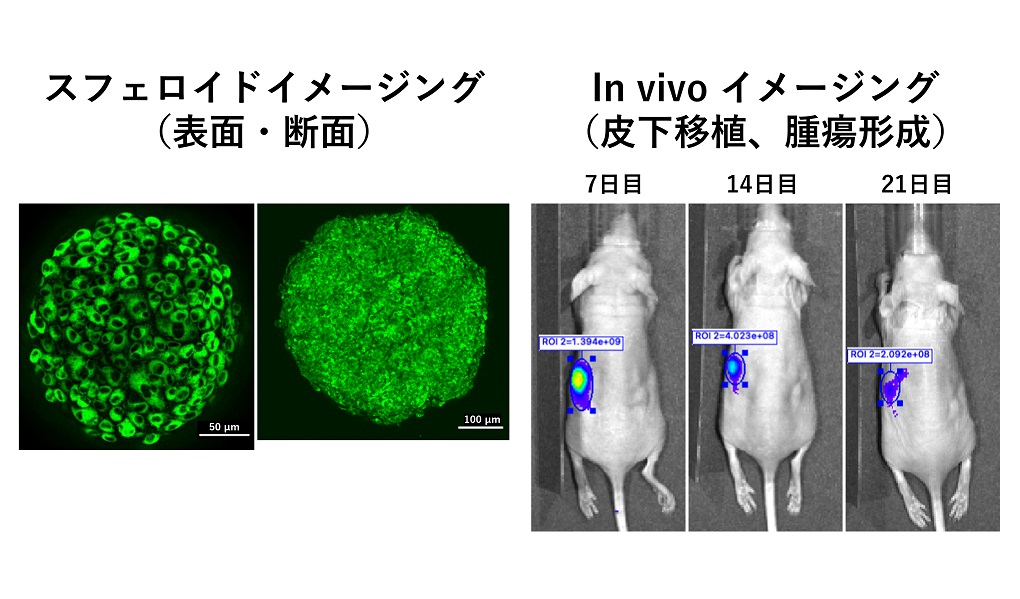
Example 2: Spheroid Staining Imaging
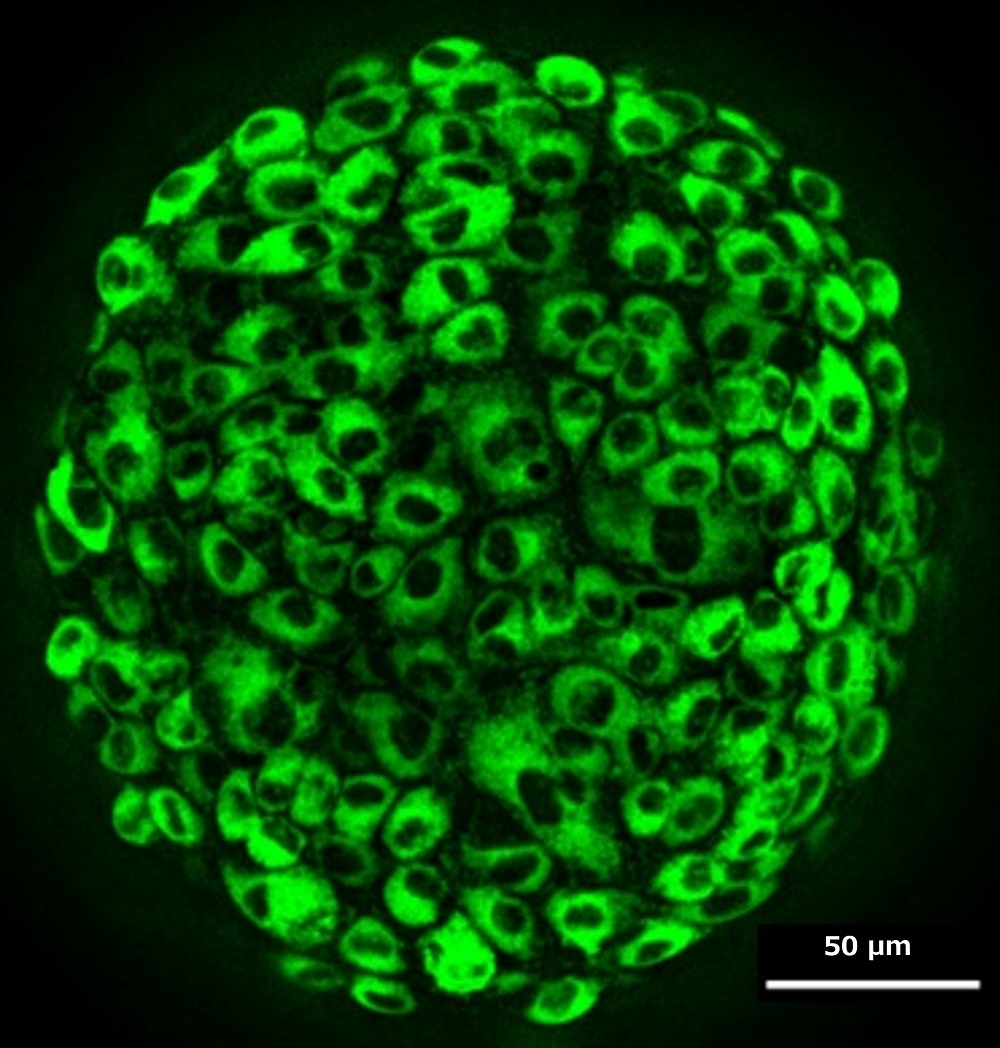
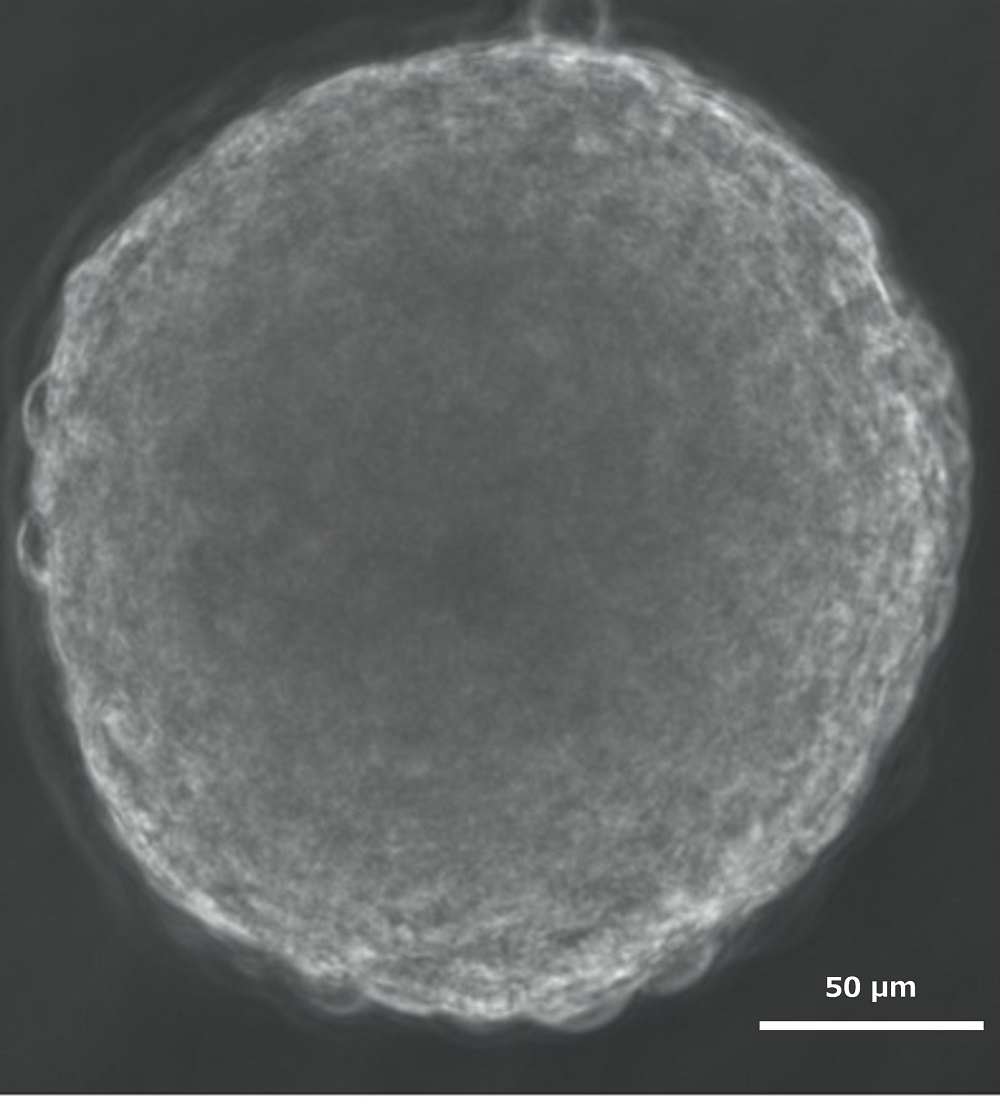
Surface Observation (Live)
You can clearly observe the cellular state on the surface of the spheroids
Staining with FI 7500 allows for detailed observation of cellular conditions that are difficult to capture with phase-contrast imaging.
<Protocol>
① Seed NIH/3T3 cells into a U-bottom plate to create spheroids.
② Add FI 7500 (0.2 μM) to the prepared spheroid, let it stand for 30 minutes (37°C), and wash three times with PBS.
③ Observe with a fluorescence microscope
| NIH/3T3 Number of cells: 5000 cells | |
|---|---|
| fluorescent image | phase contrast image |
 |
 |
緑:Sciforiem® FI 7500(Ex: 620±30 nm, Em: 700±37.5 nm)
(株)キーエンス社製顕微鏡BZ-X800による撮影画像
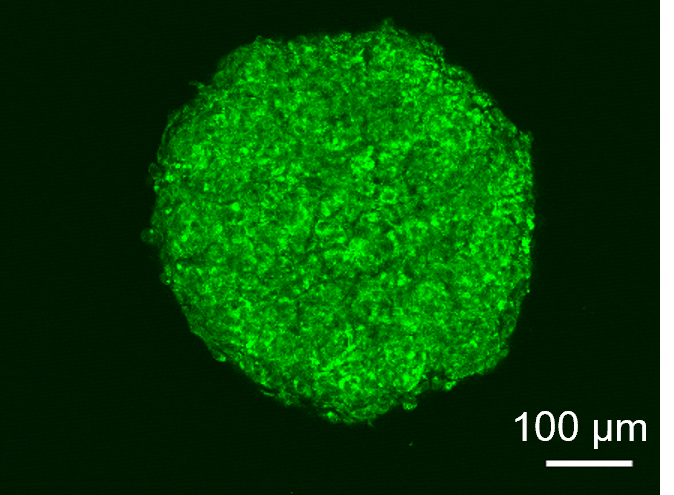
cross-sectional observation
You can observe the state of cells in the spheroid cross-section.
By imaging the spheroid in the Z-axis direction, its cross-section can be clearly observed.
<Protocol>
① Add FI 7500 (0.2 μM) to NIH/3T3 cells, let stand for 30 minutes (37°C), then wash three times with PBS.
② Seed stained cells onto a U-bottom plate to create spheroids.
③ Observe with a confocal microscope
| Fluorescence image: Number of cells: 5000 cells | |
|---|---|
| Live Performances | Fixation and transparency |
 |
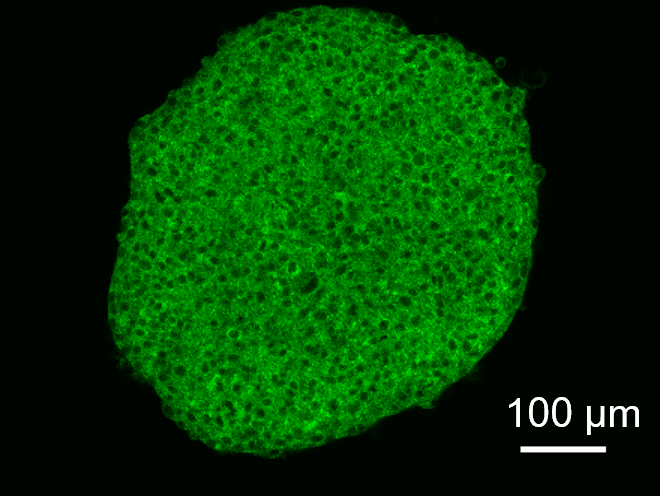 |
Green: Sciforiem ™ FI 7500 (Ex: 620±30 nm, Em: 700±37.5 nm)
Images taken with Keyence Corporation's BZ-X1000 microscope and laser confocal unit BZ-XLC1
Example 3: In vivo imaging
Subcutaneous transplantation, tumor formation
Long-term monitoring of tumors and transplanted cells is possible
A fluorescent signal was still observed on day 21 after transplantation.
<Protocol>
① Add FI 7500 (0.2 μM) to HeLa cells, let stand for 30 minutes (37°C), then wash three times with PBS.
② Mix the stained cells with Matrigel and transplant them subcutaneously into the mouse.
③ Observation using an in vivo imaging system
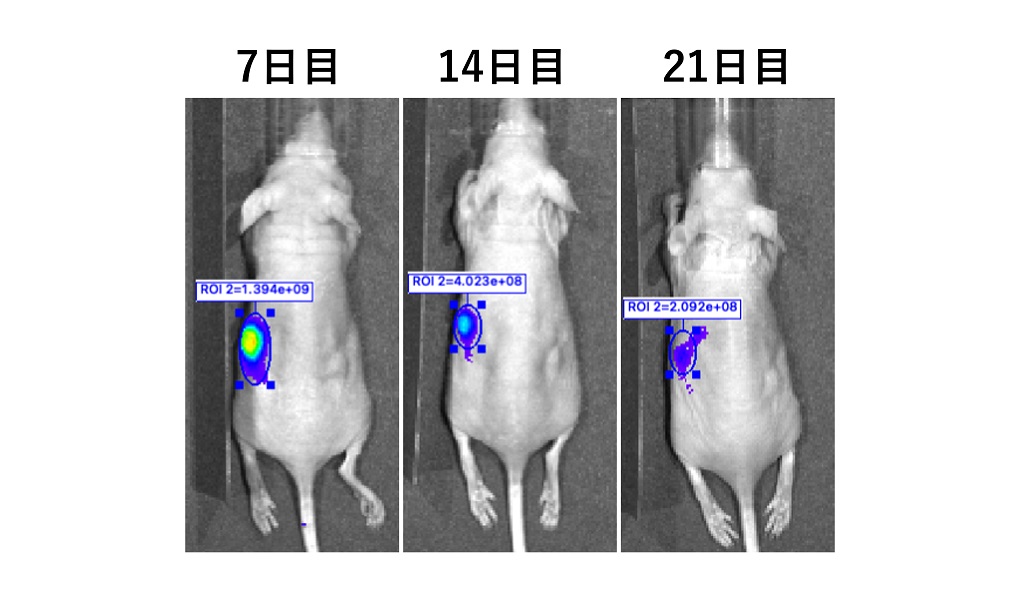
Left subcutaneous: HeLa cells stained with Sciforiem ™ FI 7500
Right subcutaneous: Unstained HeLa cells (blank)
(IVIS Spectrum Ex: 710 nm, Em: 760 nm)
Filming cooperation: National Cancer Center Research Institute, Animal Experiment Facility, Dr. Kasai and Dr. Nakano
cell tracking
It is possible to track cells in real time within the body
We confirmed that after administering MSC cells stained with FI 7500 into the tail vein of mice, we could track their accumulation in organs in real time, starting immediately after administration.
Furthermore, ex vivo studies confirmed that MSC cells were accumulating in the liver and lungs.
<Protocol>
① Add FI 7500 (0.2 μM) to the MSC cells, let stand for 30 minutes (37°C), then wash three times with PBS.
② Administer stained cells via the tail vein of a mouse.
③ Observation using an in vivo imaging system
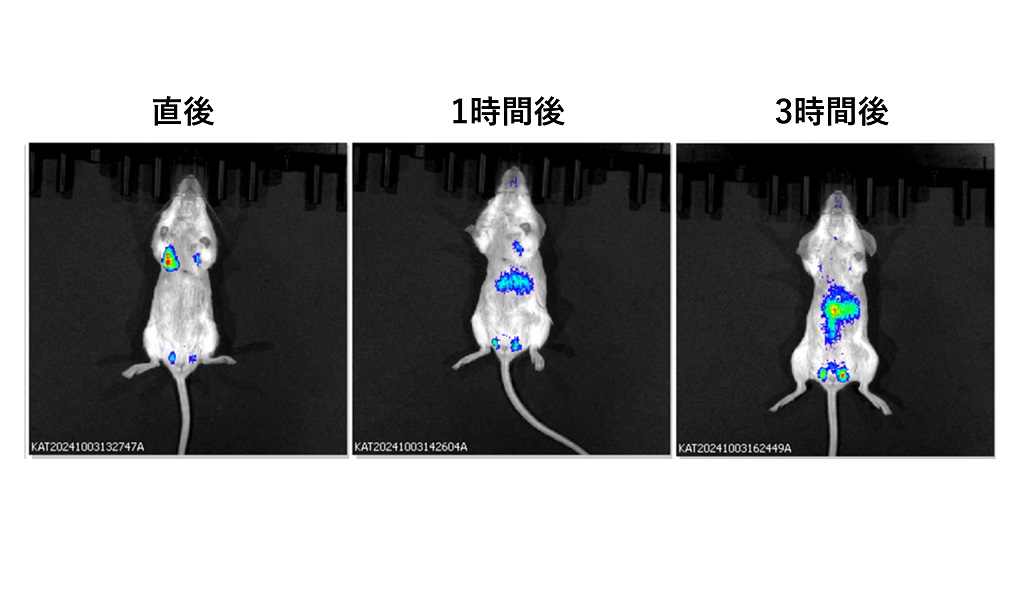
(IVIS Spectrum Ex: 710 nm, Em: 760 nm)
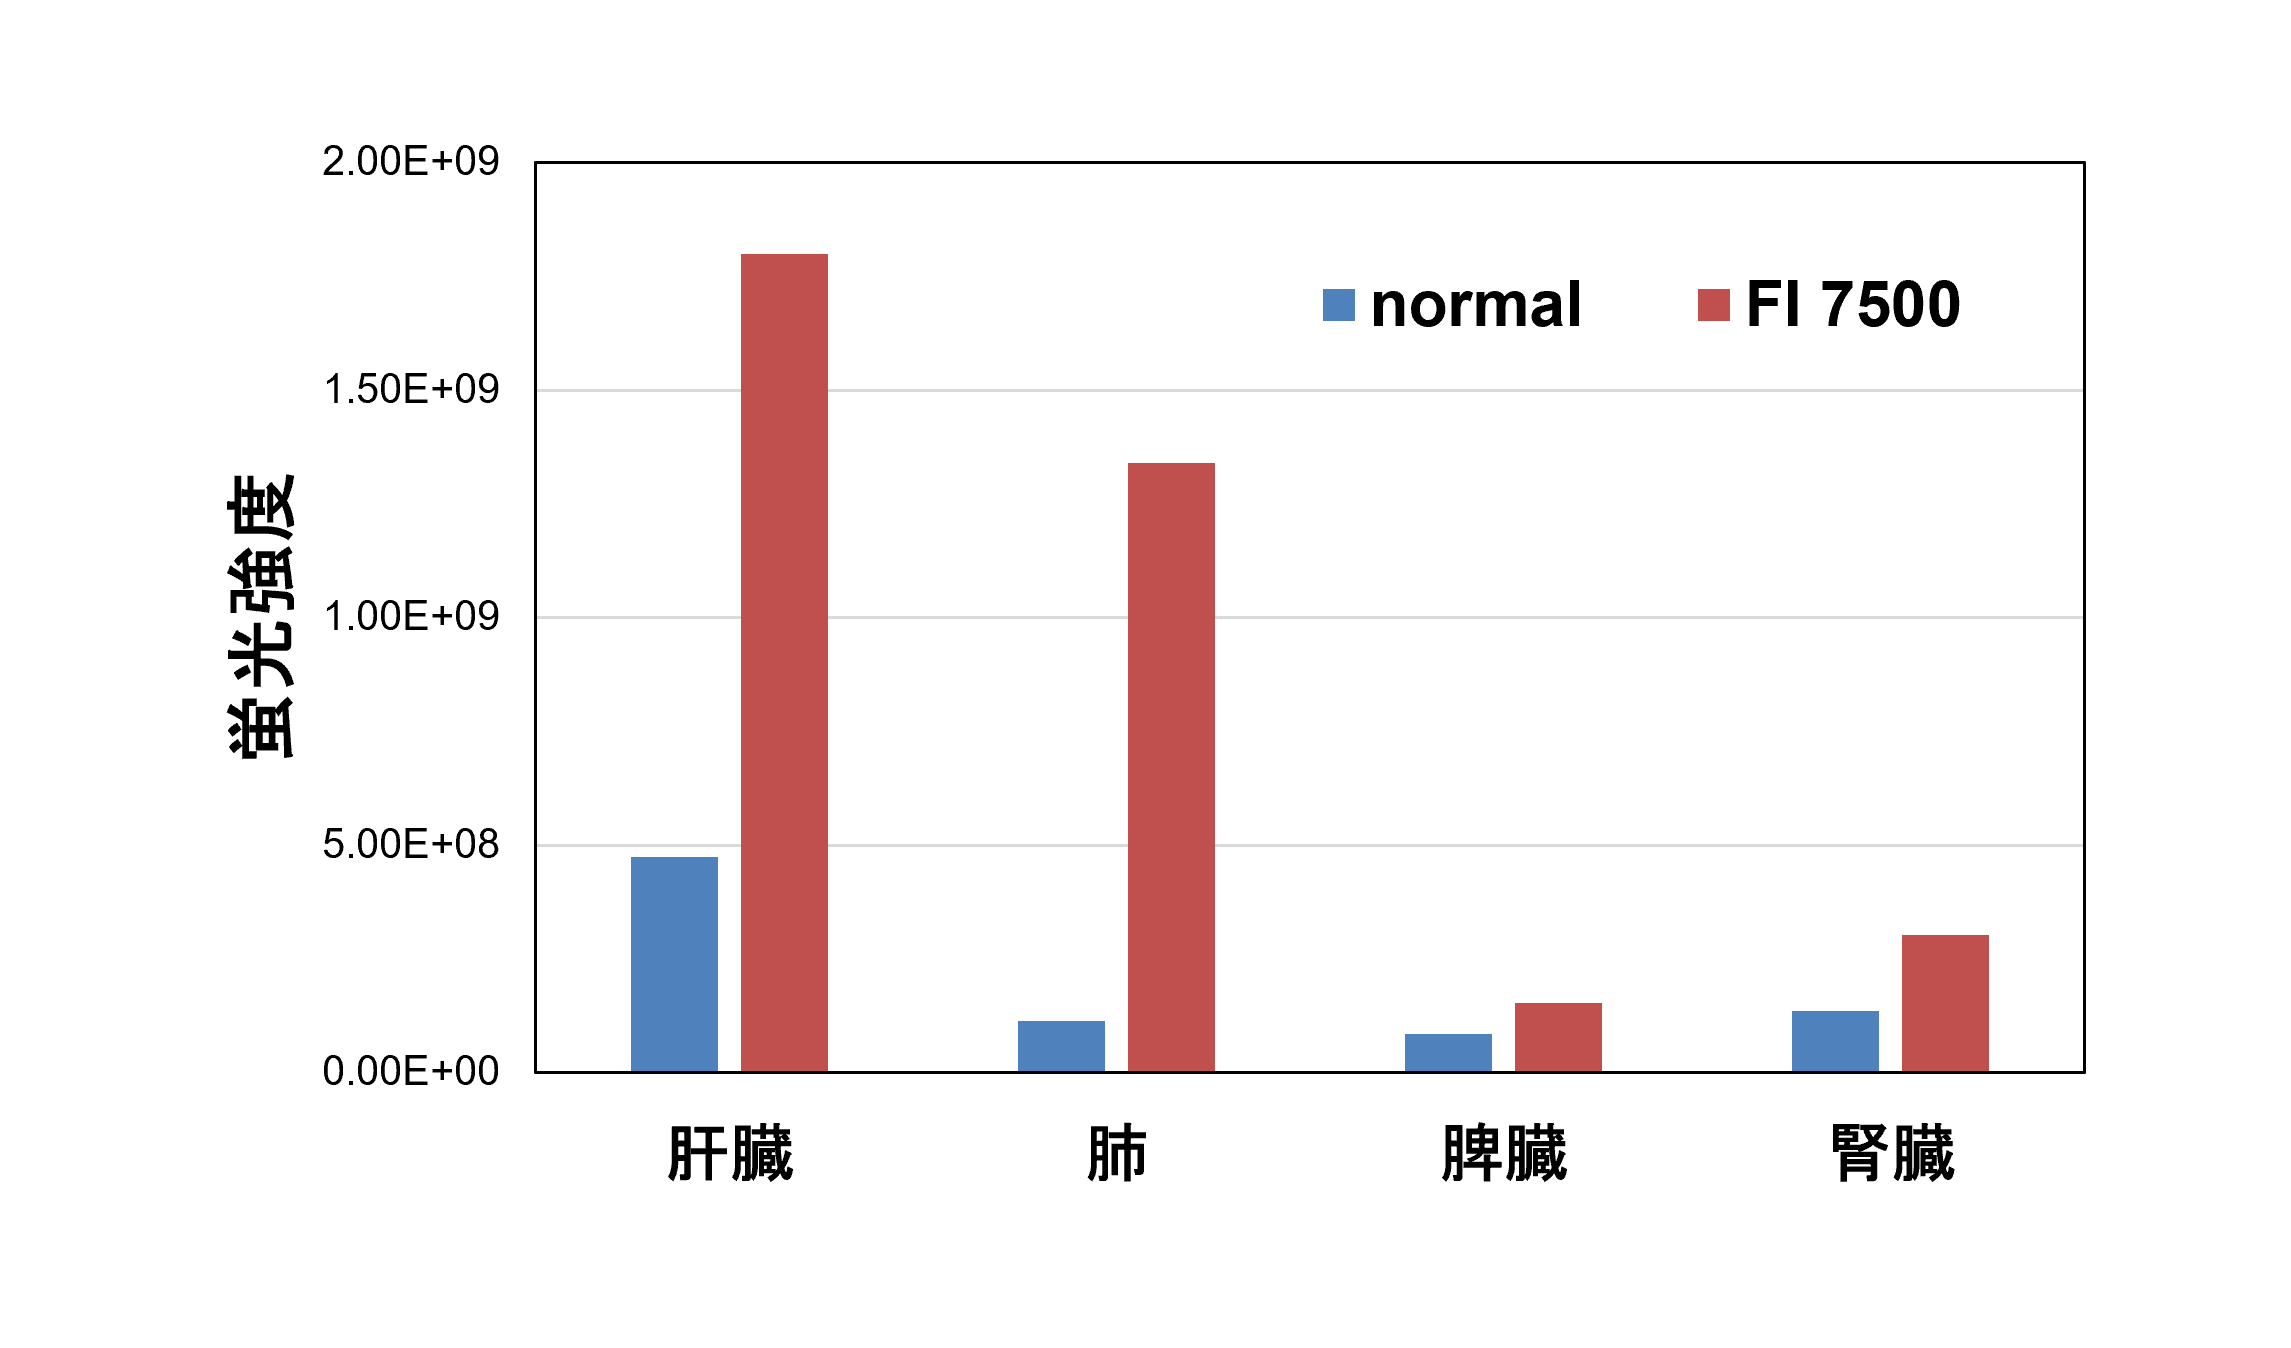
Filming cooperation: Nagoya University Next-Generation Biomaterials Hub ARIM Project
Research Efficiency Improvement with Fluorescence Method (FI 7500)
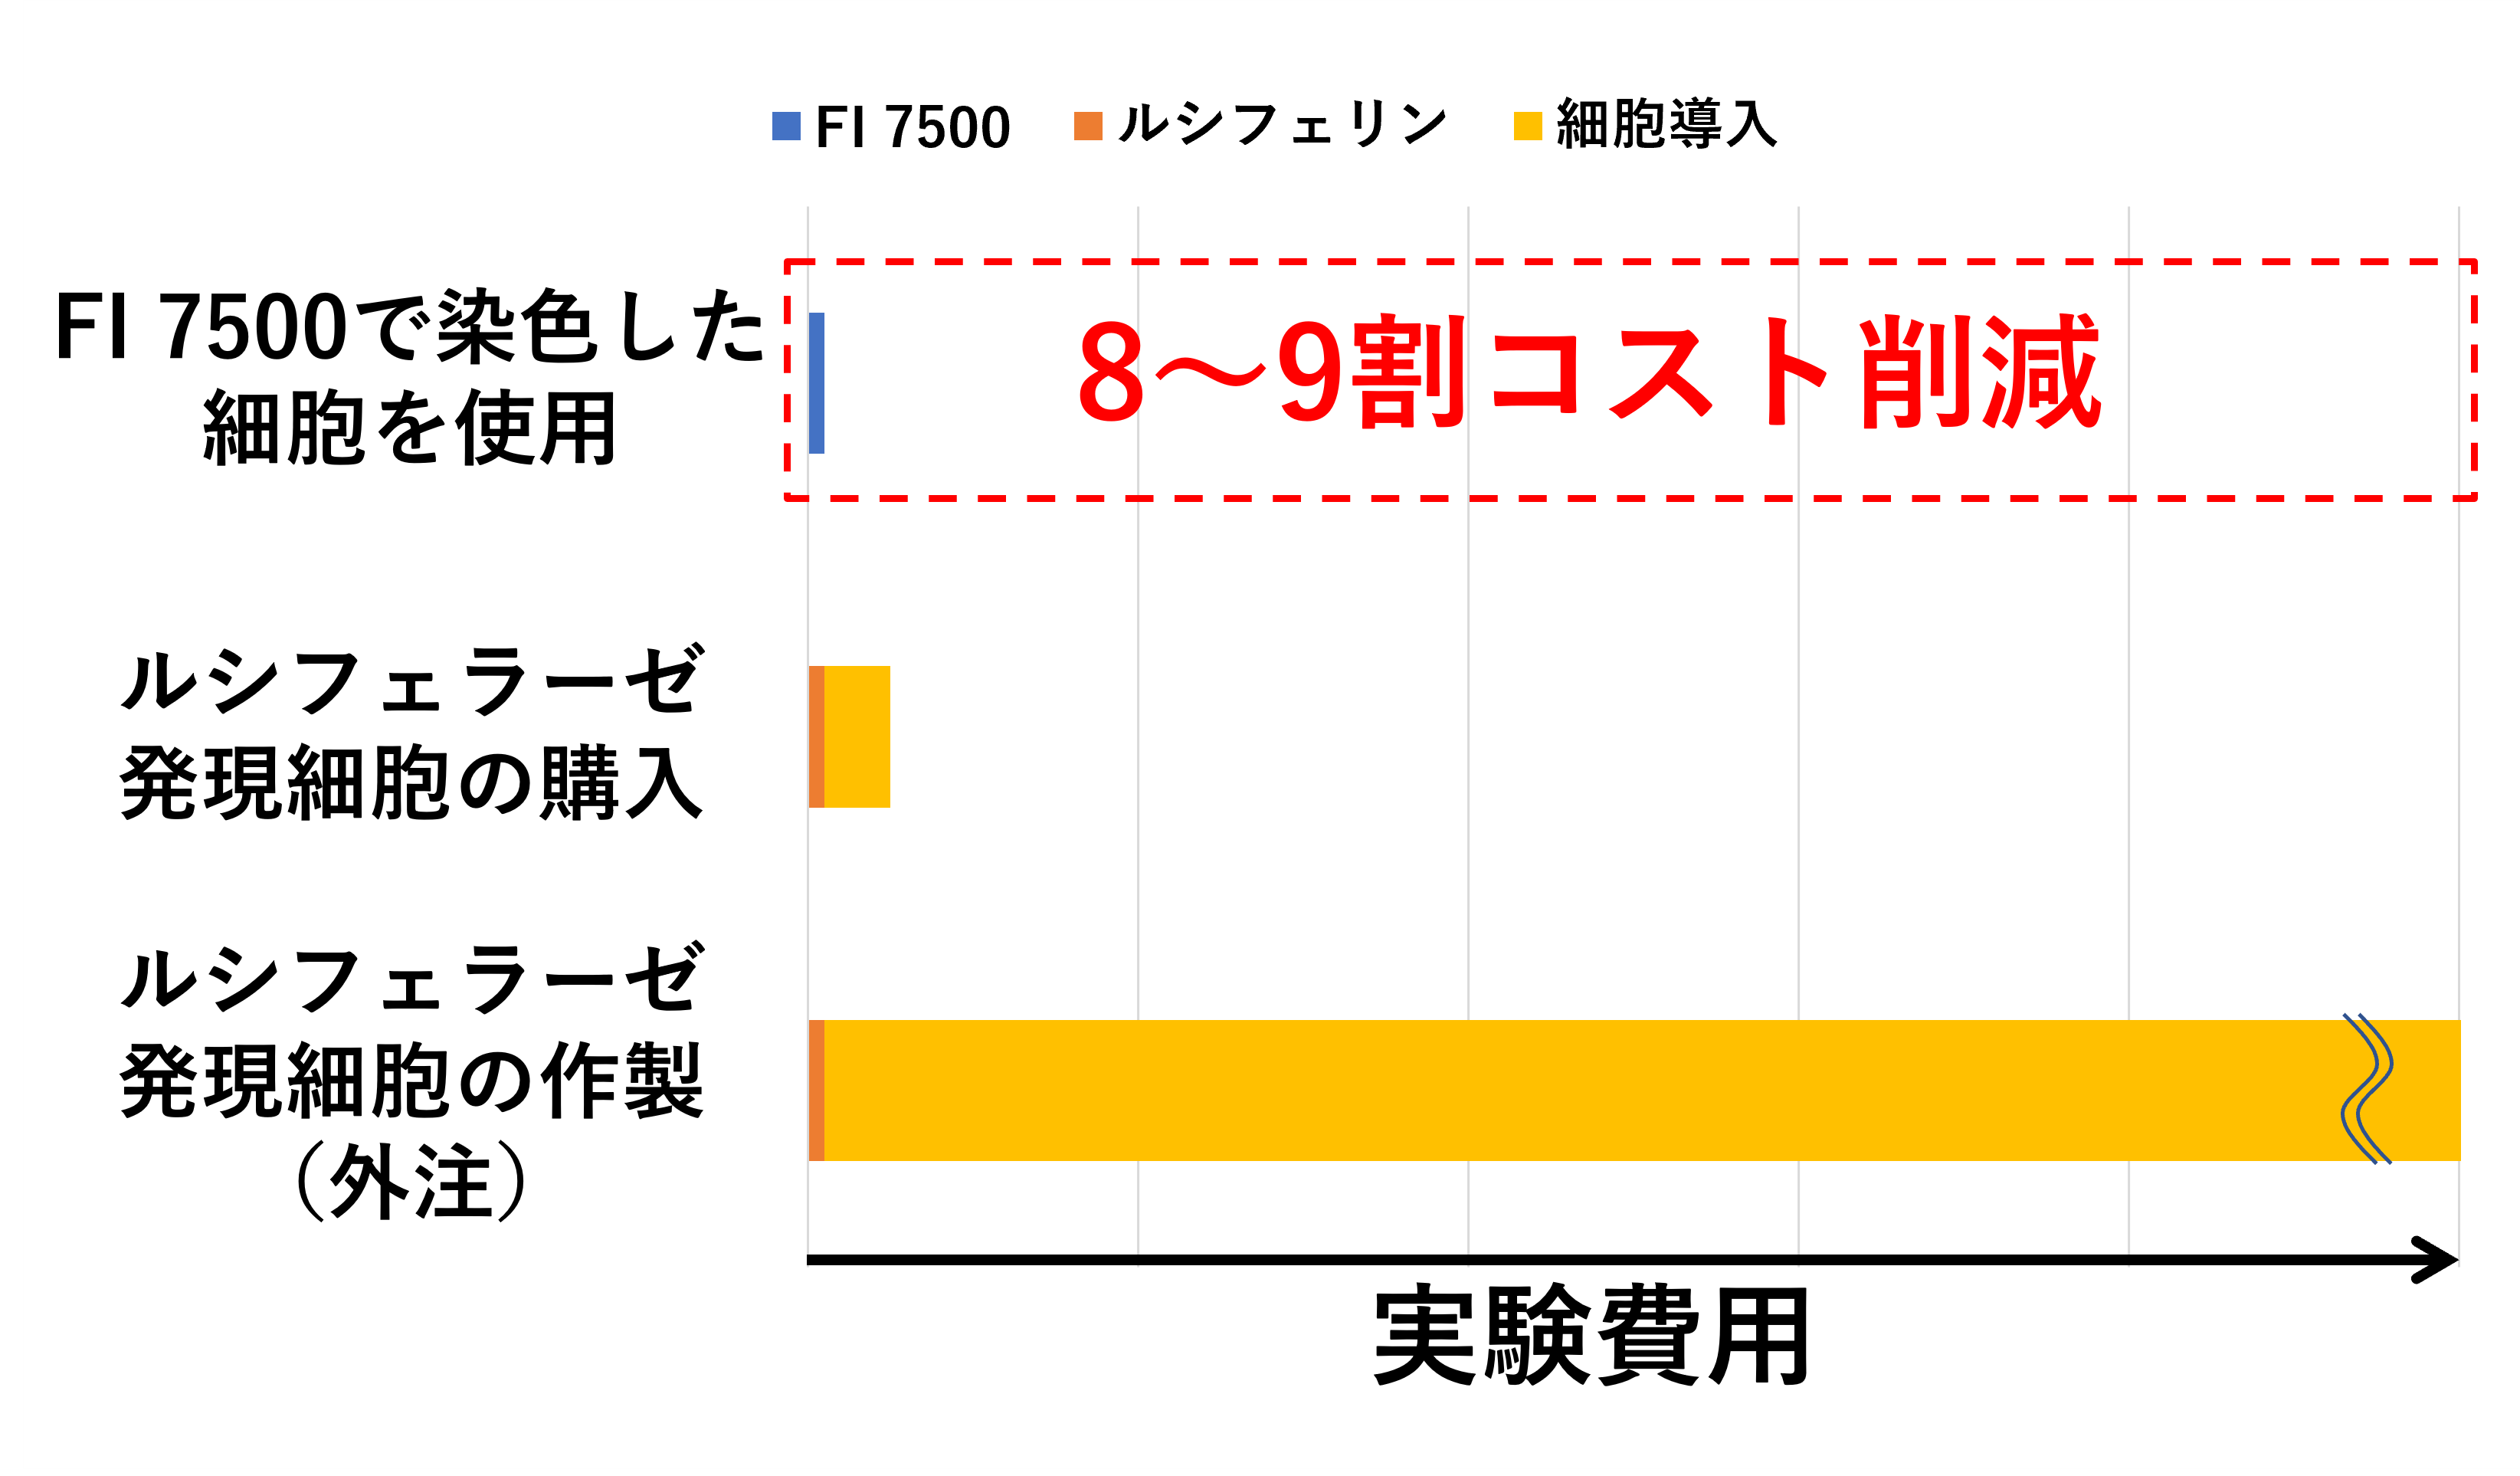
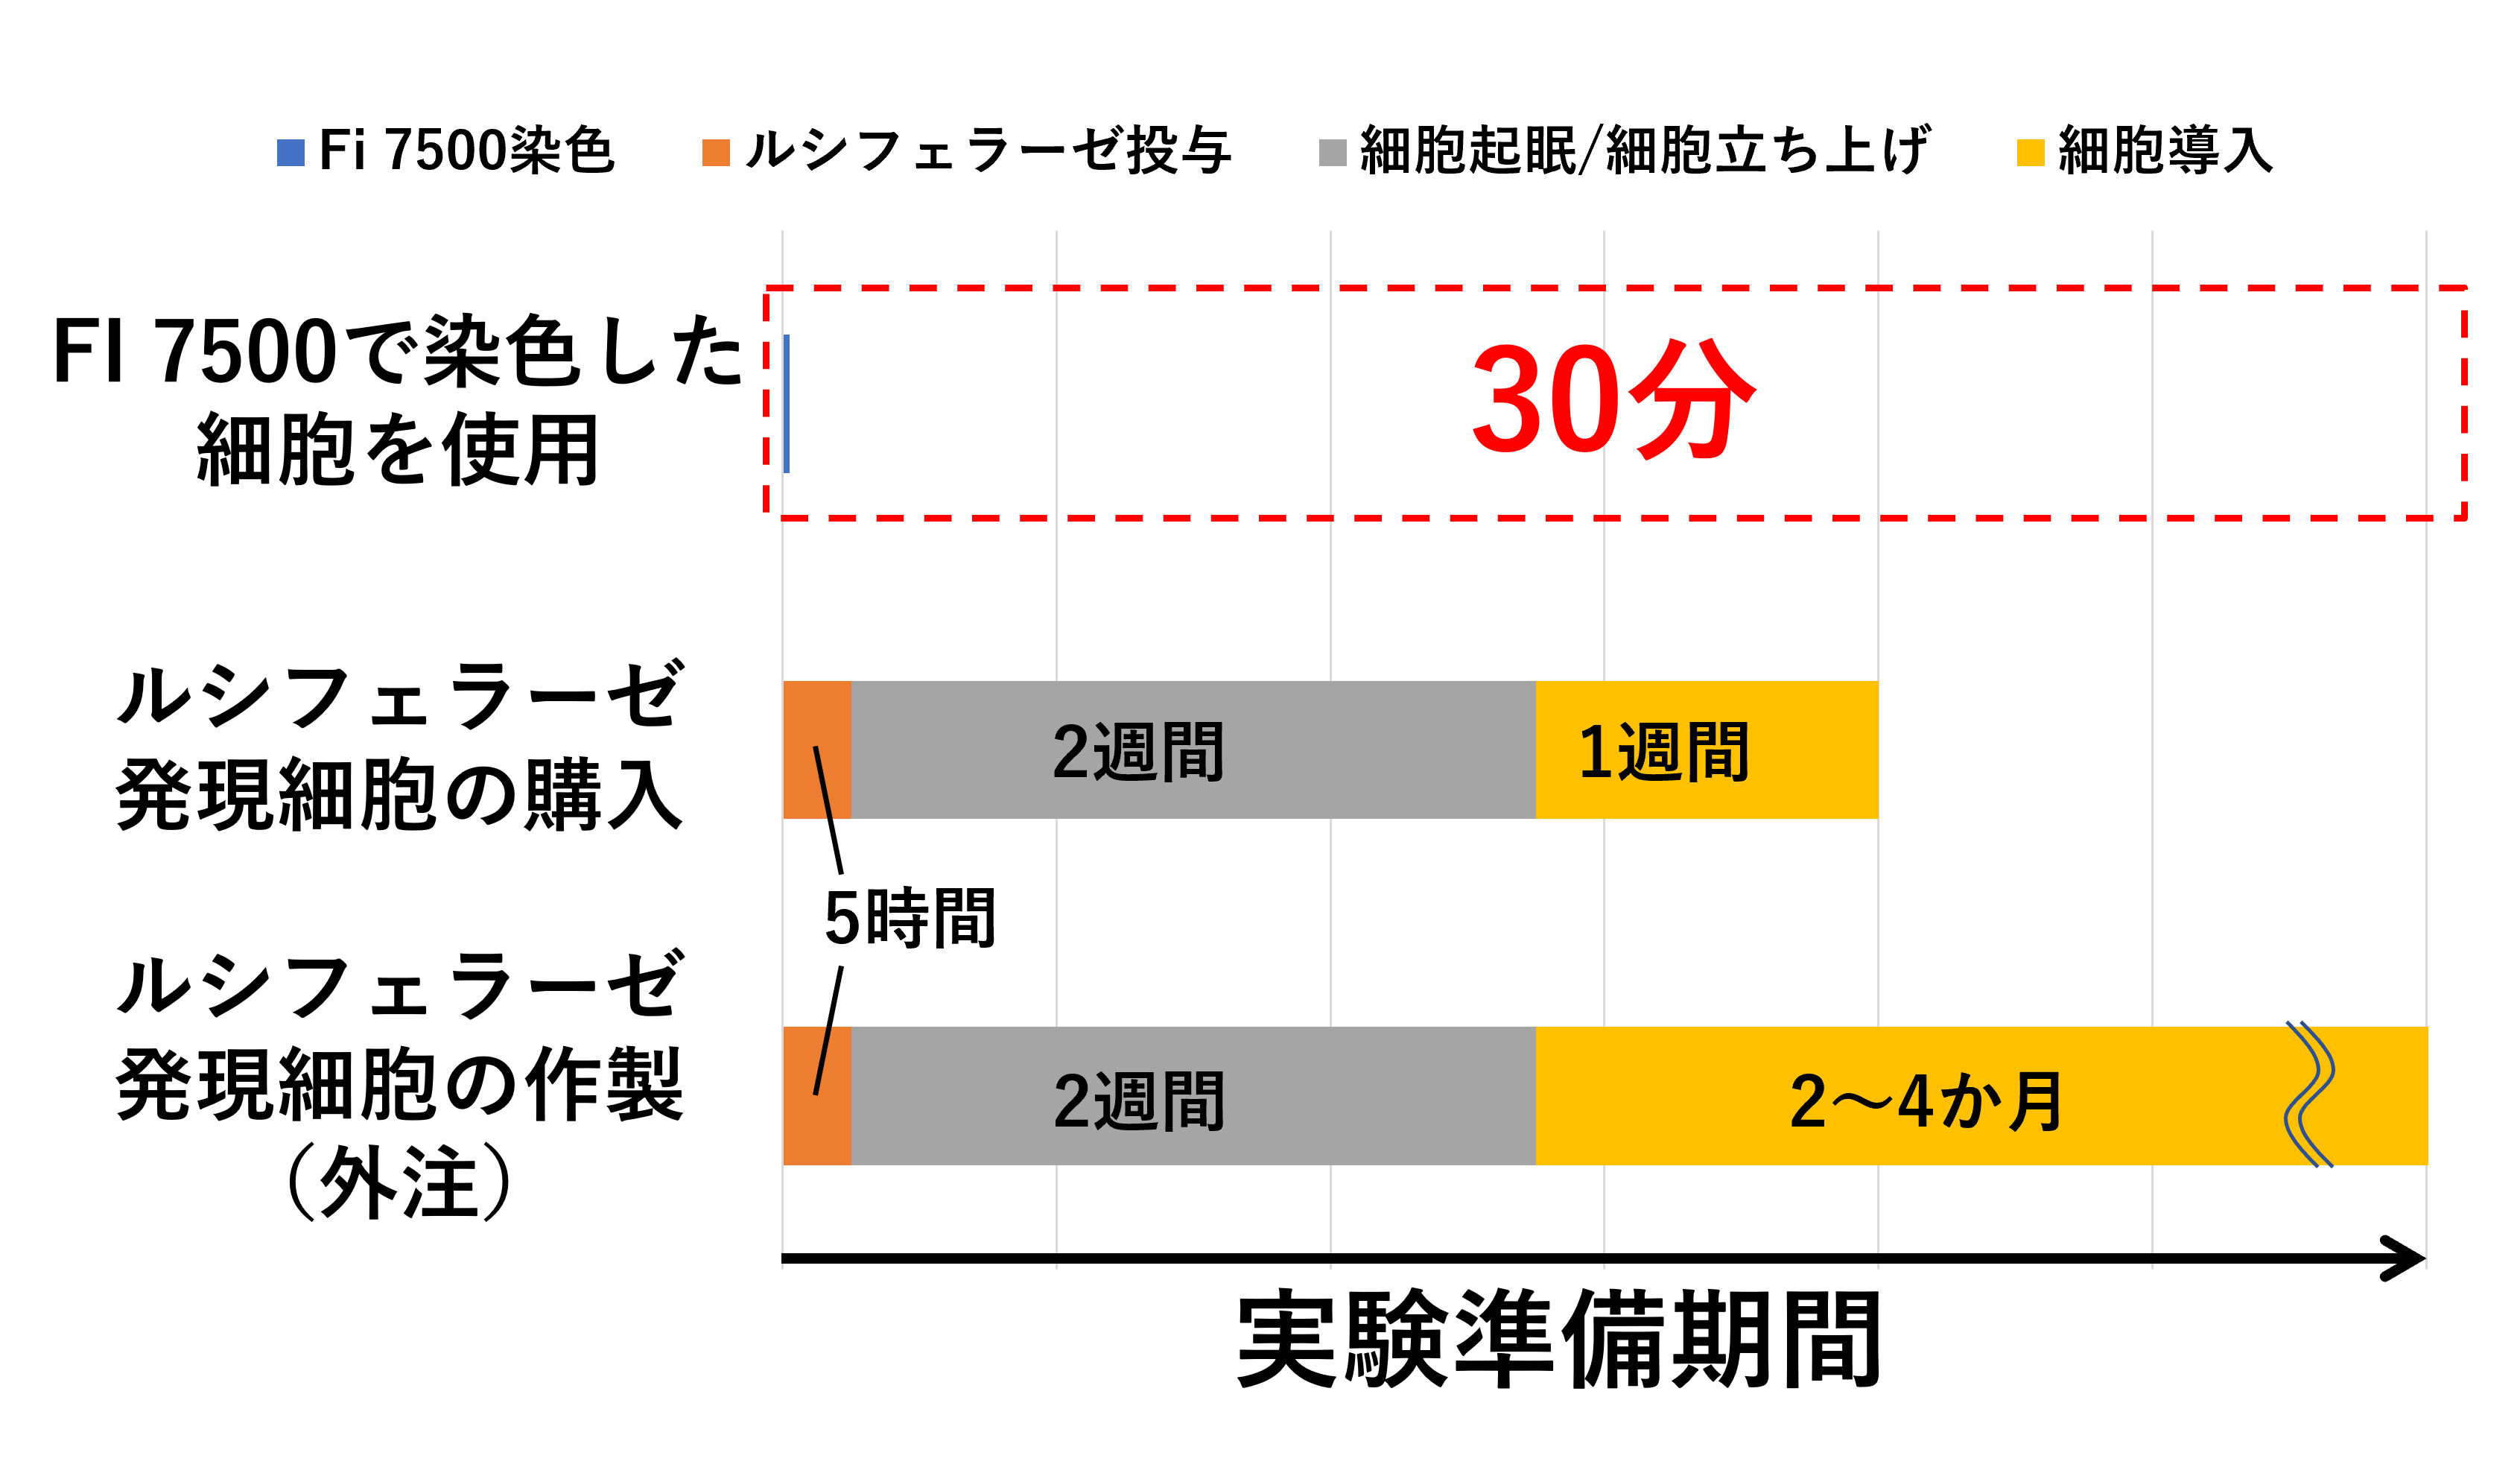
Compared to bioluminescence methods (such as luciferase), the FI 7500 significantly reduces experimental costs and preparation periods, contributing to greater research efficiency.
Experimental costs can be reduced by about 80~90%.
Experiment preparation time can be reduced by 99%.
Application Example 4: Cell Proliferation Monitoring
Because it emits stable fluorescence over a long period, it enables more accurate monitoring of cell proliferation
We confirmed that after administering MSC cells stained with FI 7500 into the tail vein of mice, we could track their accumulation in organs in real time, starting immediately after administration.
Furthermore, ex vivo studies confirmed that MSC cells were accumulating in the liver and lungs.
<Protocol>
① Add FI 7500 (0.2 μM) to the MSC cells, let stand for 30 minutes (37°C), then wash three times with PBS.
② Administer stained cells via the tail vein of a mouse.
③ Observation using an in vivo imaging system
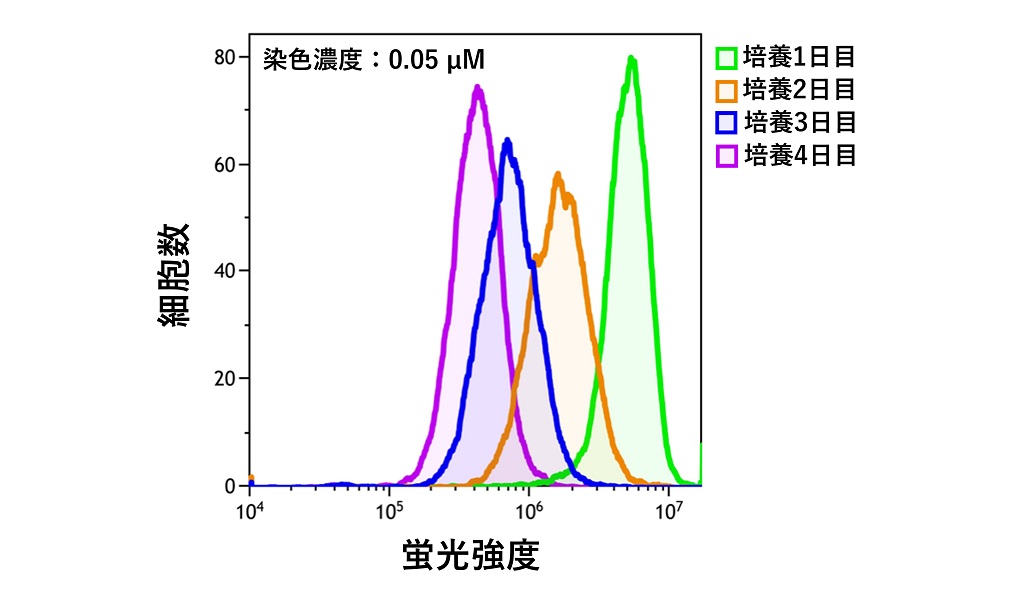
FCM measurement: EX: 638 nm, Em: 712 nm
Reagent for lipid nanoparticle staining Sciforiem ™ FI 7510
Sciforiem ™ FI 7510 has a high affinity for phospholipids (POPC), making it suitable for staining lipid nanoparticles such as liposomes.
Spectral Spectrum and Confocal Microscopy Images
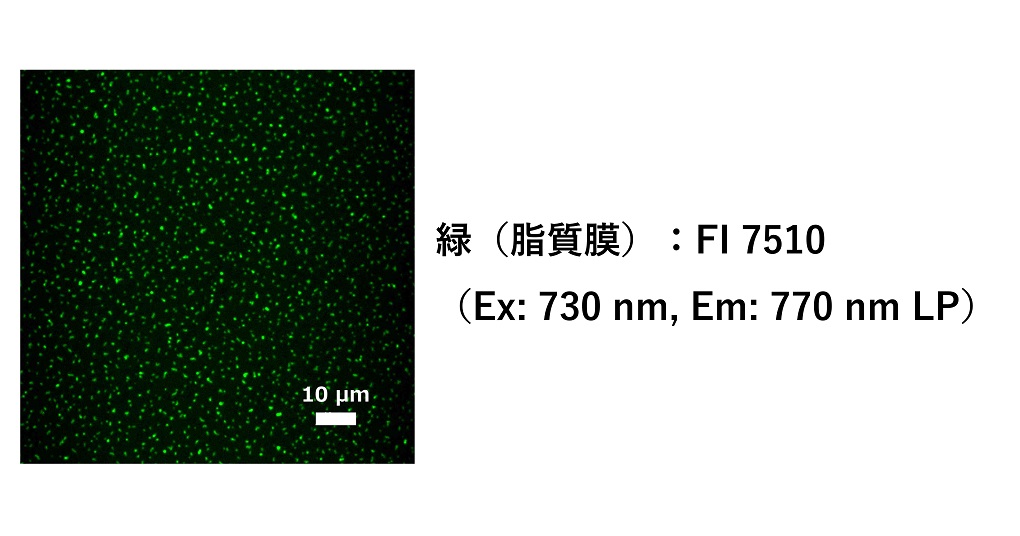
Photography cooperation: Images taken by Nikon Inc., super-resolution confocal laser microscope system AX R with NSPARC
Sciforiem ™ Dyeing Principle of FI 7510
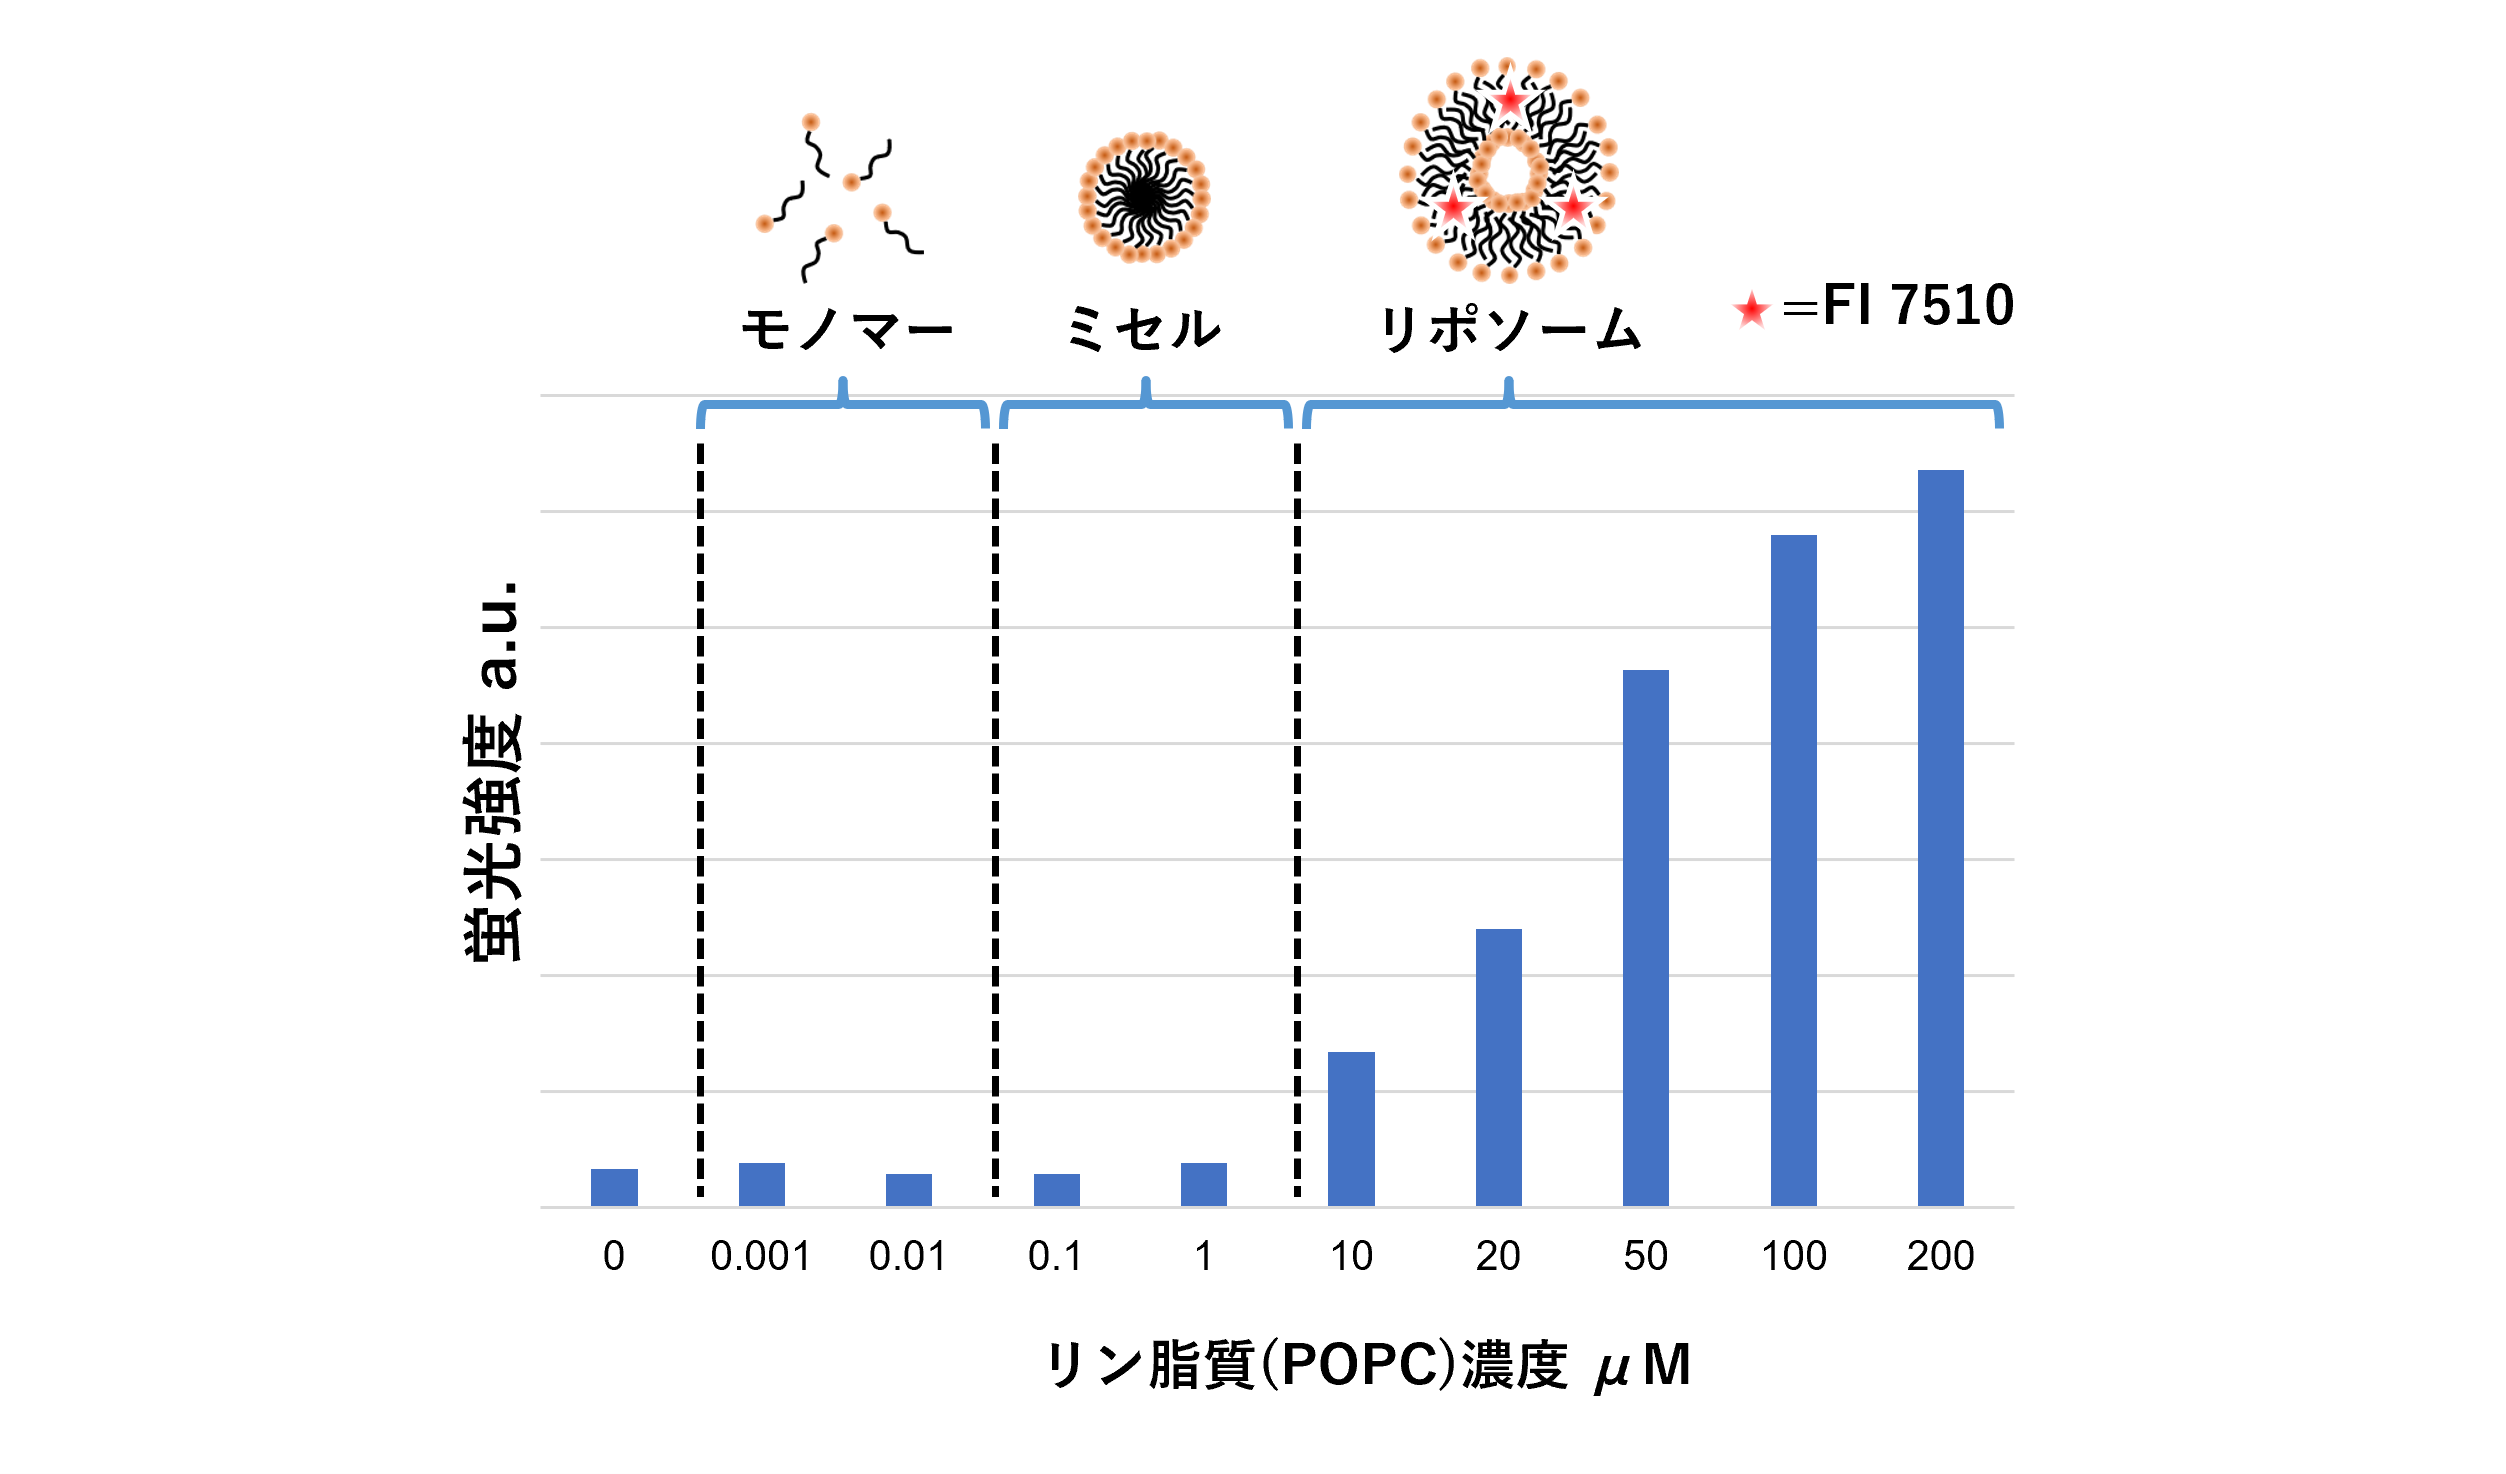
FI 7510 penetrates the lipid bilayer and stains the liposomes
In experiments controlling lipid morphology by phospholipid concentration, the fluorescence of FI 7510 increased during liposome formation, demonstrating excellent staining for liposomes.
(Dyeing concentration 0.2 μM)
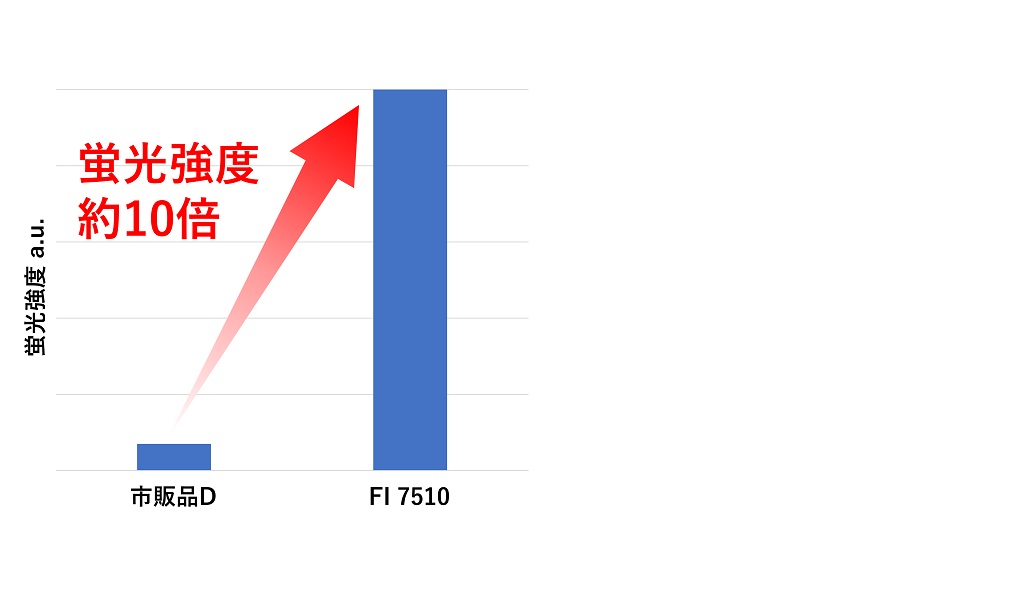
Compared to commercial product D, its fluorescence intensity is about ten times higher.
Dyeing concentration 0.2 μM, phospholipid concentration 200 μM
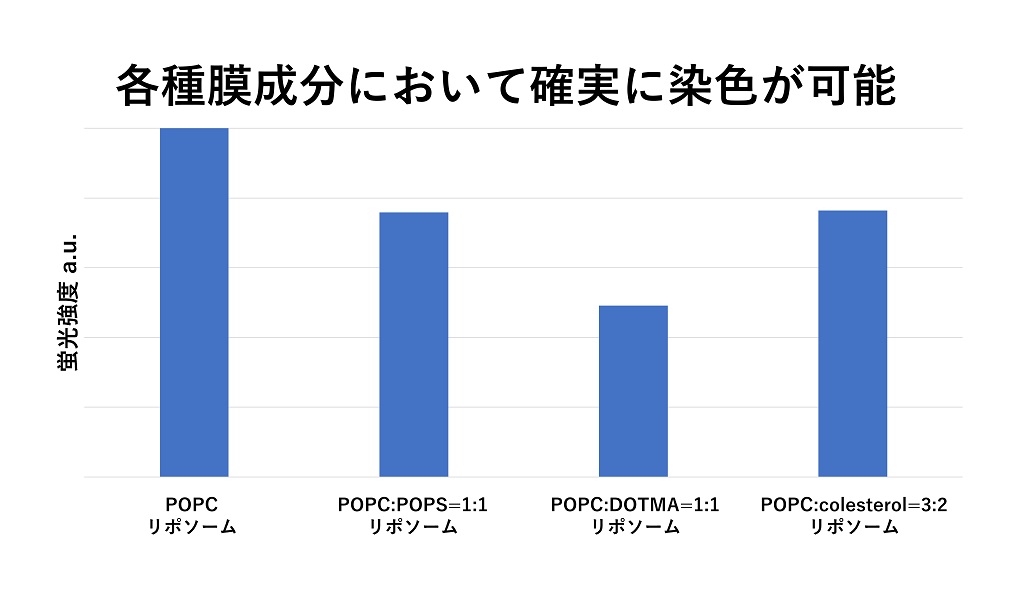
It can reliably dye various membrane components.
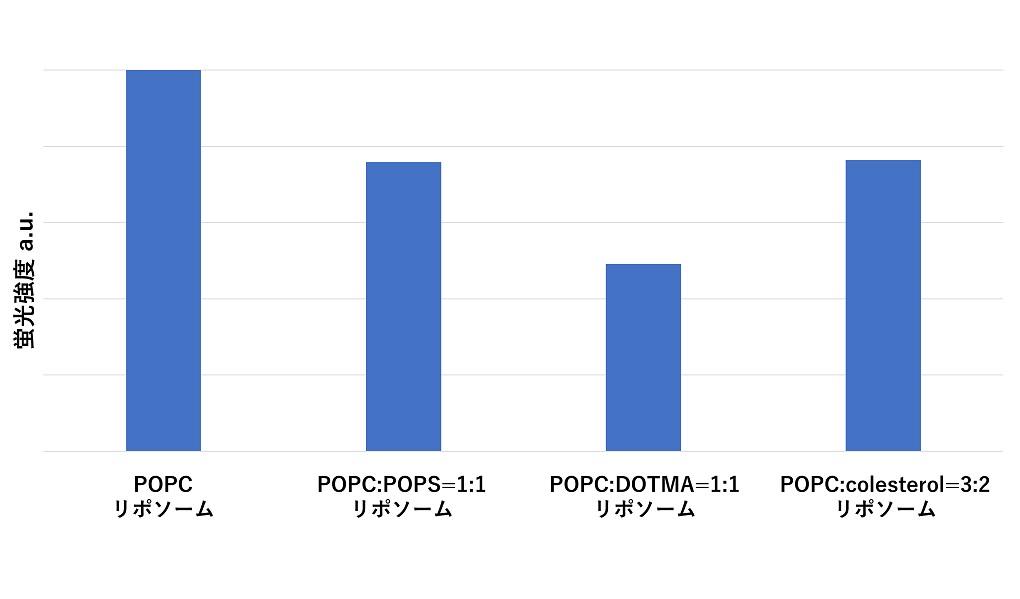
Dyeing concentration 0.2 μM, phospholipid concentration 200 μM
Technology overview
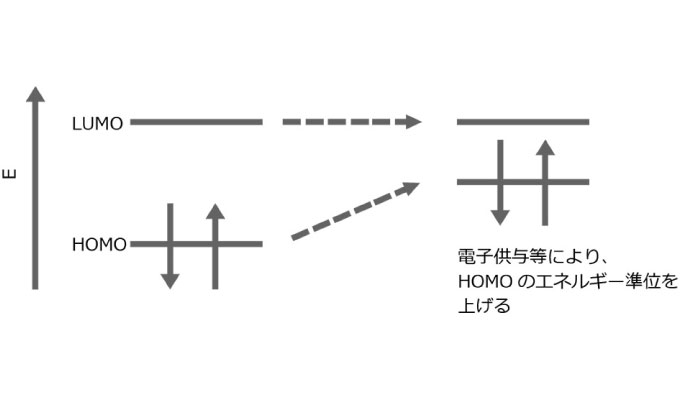
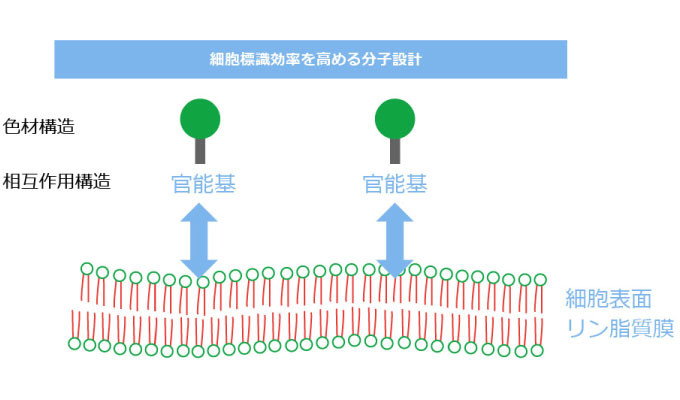
Colorant absorption/fluorescence wavelength control technology x Cell-interacting functional group introduction technology
The main light-absorbing substances that exist in living organisms are water (more than 2000 nm) and hemoglobin in blood (less than 700 nm), so light in the near-infrared region with a wavelength of 700 nm to 2000 nm is not absorbed by these substances. , penetrate deeply into living tissues. At our company, we have combined the "colorant absorption/fluorescence wavelength control technology" cultivated in the display and electronics fields with our unique "cell-interacting functional group introduction technology" to achieve clearer labeling functions, long-term luminescence maintenance, and We are developing colorants with characteristics suitable for new observation systems, such as in-vivo stability and photostability.
We aim to apply this coloring material not only to regenerative medicine but also to a wide range of fields such as biopharmaceutical screening and in vitro diagnostic systems.
生体組織による光吸収の波長依存性
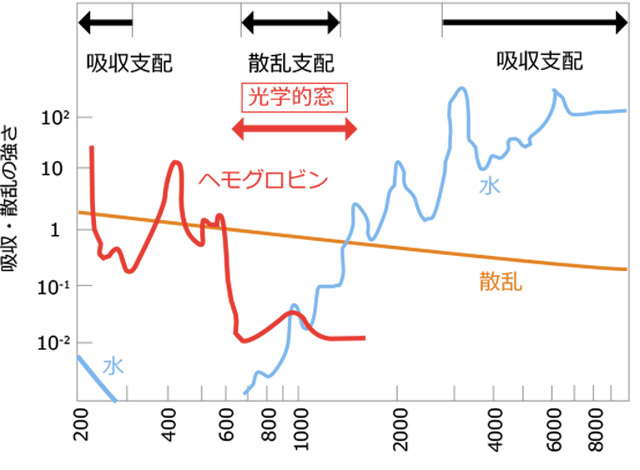
出典: 山田幸生 (2025) .「診断技術のための生体医用光学入門」.東京大学出版会.
Colorant absorption/fluorescence wavelength control technology
Technology for introducing cell-interacting functional groups
Sales Agent & Contact Information
This product is available for purchase from Nakarai Tesque Co., Ltd.
<Contact Us>
artience Co., Ltd. Incubation Center
TEL: +81-3-3272-0242
Share


